Zonal Statistics - categorical values
You can treat rasters as categorical (i.e. raster values represent discrete classes) if you’re only interested in the counts of unique pixel values.
For example, you may have a crop type raster and want to summarize number of pixels of each classes by polygon. Statistics such as mean, median, sum, etc. don’t make much sense in this context (What’s the sum of urban + grassland?).
[1]:
import os
import pandas as pd
import geopandas as gpd
import rasterio
import rasterio.plot
import rasterstats
from rasterstats import zonal_stats
import matplotlib.pyplot as plt
from pathlib import Path
from IPython.display import display
import plotly.express as px
import plotly.offline
plotly.offline.init_notebook_mode()

print('All libraries successfully imported!')
print(f'Rasterstats : {rasterstats.__version__}')
All libraries successfully imported!
Rasterstats : 0.17.0
Set directory
[2]:
computer_path = '/export/miro/ndeffense/LBRAT2104/'
grp_nb        = '99'


data_path = f'{computer_path}data/'                        # Directory with data shared by the assistant
work_path = f'{computer_path}STUDENTS/GROUP_{grp_nb}/TP/'  # Directory for all work files

lut_path  = f'{data_path}LUT/'


classif_path    = f'{work_path}CLASSIF/'
zonal_stat_path = f'{work_path}ZONAL_STATS/'

Path(zonal_stat_path).mkdir(parents=True, exist_ok=True)

print(f'Zonal Statistics path is set to : {zonal_stat_path}')
Zonal Statistics path is set to : /export/miro/ndeffense/LBRAT2104/STUDENTS/GROUP_99/TP/ZONAL_STATS/
Set parameters
[3]:
site = 'NAMUR'
year = '2020'

nodata_val = -10000

vector_field = 'name'

feat_nb = 2

field_classif_code = 'grp_1_nb'
field_classif_name = 'grp_1'

reclassify_flag = True

if reclassify_flag:
    field_reclassif_code = 'grp_A_nb'
    field_reclassif_name = 'grp_A'

    field_lut_code = field_reclassif_code
    field_lut_name = field_reclassif_name

else:
    field_lut_code = field_classif_code
    field_lut_name = field_classif_name
Set filenames
[4]:
lut_xlsx     = f'{lut_path}crop_dictionary.xlsx'
vector_file  = f'{data_path}ROI_NAMUR/extent_roi_32631.shp'

raster_file  = f'{classif_path}{site}_{year}_classif_RF_feat_{feat_nb}_{field_classif_name}.tif'

if reclassify_flag:
    raster_file = f'{classif_path}{site}_{year}_classif_RF_feat_{feat_nb}_{field_classif_name}_reclassify_{field_reclassif_name}.tif'


zonal_stat_csv  = f'{zonal_stat_path}{site}_{year}_zonal_stat_cat.csv'
zonal_stat_html = f'{zonal_stat_path}{site}_{year}_zonal_stat_cat.html'
Check if raster and vector are projected to the same CRS
[5]:
gdf = gpd.read_file(vector_file)
src = rasterio.open(raster_file, "r")

crs_vector = str(gdf.crs).split(":",1)[1]
crs_raster = str(src.crs).split(":",1)[1]

if crs_vector == crs_raster:
    print(f'CRS are the same : EPSG:{crs_vector} = EPSG:{crs_raster}')
else:
    print('We must reproject vector file')

    gdf = gdf.to_crs(epsg=crs_raster)
CRS are the same : EPSG:32631 = EPSG:32631
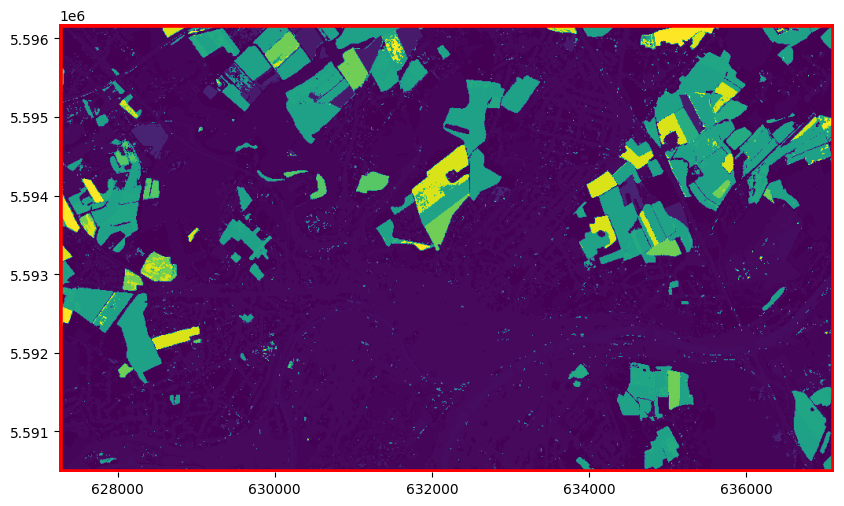
Check if raster and vector file are intersecting
[6]:
fig, ax = plt.subplots(1, 1, figsize=(10,10))

# Plot vector
gdf.plot(facecolor='none', edgecolor='red', linewidth = 4, ax=ax)

# Plot image
rasterio.plot.show(src, ax=ax)

plt.box(False)
Build category map
rasterstats will report using the pixel values as keys. To associate the pixel values with their appropriate meaning, you can use a category_map
[7]:
if os.path.isfile(lut_xlsx):

    lut_df = pd.read_excel(lut_xlsx)

    lut_df = lut_df[[field_lut_code,field_lut_name]].drop_duplicates()

    cmap = {}

    for index, row in lut_df.iterrows():

        nb   = row[field_lut_code]
        name = row[field_lut_name]

        cmap[nb] = f'{nb} - {name}'

else:
    cmap = None

print(cmap)
{0: '0 - Remove', 111: '111 - Wheat', 112: '112 - Maize', 113: '113 - Rice', 114: '114 - Sorghum', 115: '115 - Barley', 116: '116 - Rye', 117: '117 - Oats', 118: '118 - Millets', 119: '119 - Other cereals', 121: '121 - Leafy or stem vegetables', 122: '122 - Fruit-bearing vegetables', 123: '123 - Root, bulb or tuberous vegetables', 124: '124 - Mushrooms and truffles', 141: '141 - Soya beans', 142: '142 - Groundnuts', 143: '143 - Other oilseed crops', 151: '151 - Potatoes', 152: '152 - Sweet potatoes', 153: '153 - Cassava', 154: '154 - Yams', 161: '161 - Spice crops', 162: '162 - Hops', 17: '17 - Leguminous crops', 181: '181 - Sugar beet', 182: '182 - Sugar cane', 3: '3 - Grassland and meadows', 192: '192 - Fibre crops', 1931: '1931 - Medicinal, aromatic, pesticidal or similar crops', 1941: '1941 - Flowers crops', 1991: '1991 - Tobacco', 21: '21 - Fruits trees', 22: '22 - Vineyards', 23: '23 - Olive groves', 24: '24 - Trees', 291: '291 - Succulent plant', 5: '5 - Shrub land', 6: '6 - Forest', 7: '7 - Bare soil', 8: '8 - Build-up surface', 9: '9 - Water bodies'}
Compute zonal statistics
[12]:
dict_list = []

for i, row in gdf.iterrows():

    name  = row[vector_field]

    dict_freq = zonal_stats(row.geometry,
                            raster_file,
                            categorical=True,
                            category_map=cmap,
                            nodata=nodata_val)[0]

    dict_freq['name'] = name

    dict_list.append(dict_freq)

df = pd.DataFrame(dict_list).set_index('name')

df.to_csv(zonal_stat_csv, sep=';')

print(f'CSV file was created : {zonal_stat_csv}')

df = df.transpose()
df = df.sort_values(by=df.columns[0], ascending=False)
display(df)
CSV file was created : /export/miro/ndeffense/LBRAT2104/STUDENTS/GROUP_99/TP/ZONAL_STATS/NAMUR_2020_zonal_stat_cat.csv
/opt/modules/python_libs/lib/python3.10/site-packages/rasterstats/main.py:156: ShapelyDeprecationWarning:

The 'type' attribute is deprecated, and will be removed in the future. You can use the 'geom_type' attribute instead.
| name | ROI_wallonia |
|---|---|
| 8 - Build-up surface | 184528 |
| 3 - Grassland and meadows | 137457 |
| 6 - Forest | 117203 |
| 111 - Wheat | 47833 |
| 112 - Maize | 13417 |
| 181 - Sugar beet | 9793 |
| 9 - Water bodies | 9234 |
| 115 - Barley | 7701 |
| 151 - Potatoes | 6552 |
| 21 - Fruits trees | 6245 |
| 17 - Leguminous crops | 6113 |
| 119 - Other cereals | 4940 |
| 192 - Fibre crops | 3519 |
| 117 - Oats | 2140 |
| 143 - Other oilseed crops | 2103 |
| 22 - Vineyards | 1297 |
| 121 - Leafy or stem vegetables | 959 |
Add area in hectare
1 pixel S2 = 100 m2 = 0,01 ha
1 pixel L8 = 900 m2 = 0,09 ha
[9]:
df['area (ha)'] = (df['ROI_wallonia']*0.01).round(2)

df
[9]:
| name | ROI_wallonia | area (ha) |
|---|---|---|
| 8 - Build-up surface | 184528 | 1845.28 |
| 3 - Grassland and meadows | 137457 | 1374.57 |
| 6 - Forest | 117203 | 1172.03 |
| 111 - Wheat | 47833 | 478.33 |
| 112 - Maize | 13417 | 134.17 |
| 181 - Sugar beet | 9793 | 97.93 |
| 9 - Water bodies | 9234 | 92.34 |
| 115 - Barley | 7701 | 77.01 |
| 151 - Potatoes | 6552 | 65.52 |
| 21 - Fruits trees | 6245 | 62.45 |
| 17 - Leguminous crops | 6113 | 61.13 |
| 119 - Other cereals | 4940 | 49.40 |
| 192 - Fibre crops | 3519 | 35.19 |
| 117 - Oats | 2140 | 21.40 |
| 143 - Other oilseed crops | 2103 | 21.03 |
| 22 - Vineyards | 1297 | 12.97 |
| 121 - Leafy or stem vegetables | 959 | 9.59 |
Add percentage
[10]:
df['percent'] = ((df.iloc[:,0]/ df.iloc[:,0].sum())*100).round(2)

df
[10]:
| name | ROI_wallonia | area (ha) | percent |
|---|---|---|---|
| 8 - Build-up surface | 184528 | 1845.28 | 32.89 |
| 3 - Grassland and meadows | 137457 | 1374.57 | 24.50 |
| 6 - Forest | 117203 | 1172.03 | 20.89 |
| 111 - Wheat | 47833 | 478.33 | 8.53 |
| 112 - Maize | 13417 | 134.17 | 2.39 |
| 181 - Sugar beet | 9793 | 97.93 | 1.75 |
| 9 - Water bodies | 9234 | 92.34 | 1.65 |
| 115 - Barley | 7701 | 77.01 | 1.37 |
| 151 - Potatoes | 6552 | 65.52 | 1.17 |
| 21 - Fruits trees | 6245 | 62.45 | 1.11 |
| 17 - Leguminous crops | 6113 | 61.13 | 1.09 |
| 119 - Other cereals | 4940 | 49.40 | 0.88 |
| 192 - Fibre crops | 3519 | 35.19 | 0.63 |
| 117 - Oats | 2140 | 21.40 | 0.38 |
| 143 - Other oilseed crops | 2103 | 21.03 | 0.37 |
| 22 - Vineyards | 1297 | 12.97 | 0.23 |
| 121 - Leafy or stem vegetables | 959 | 9.59 | 0.17 |
Plot histogram
[11]:
fig = px.bar(df,
             x=df.index.str.slice(start=0, stop=20),
             y=df.columns[0],
             text='percent',
             labels={'x': "Crop category",df.columns[0]:"Number of pixels"})

#fig.update_xaxes(tickfont_size=15)
#fig.update_yaxes(title_font=dict(size=20), tickfont_size=15)
#fig.update_layout(font_size=20)
fig.update_layout(xaxis_title=None)

fig.show()
fig.write_html(zonal_stat_html)