Zonal Statistics - continuous values
If you are interested of NDVI mean by polygon for each date of a timeserie for instance.
[57]:
import glob, os
import pandas as pd
import geopandas as gpd
import rasterio
import rasterio.plot
import rasterstats
from rasterstats import zonal_stats
import matplotlib.pyplot as plt
from pathlib import Path
import datetime
from IPython.display import display
import numpy as np
import plotly.express as px
import plotly.graph_objects as go
import plotly.offline
plotly.offline.init_notebook_mode()

print('All libraries successfully imported!')
print(f'Rasterstats : {rasterstats.__version__}')
All libraries successfully imported!
Rasterstats : 0.17.0
[58]:
import warnings
warnings.filterwarnings("ignore")

print("BE CAREFULL warning are masked !!")
BE CAREFULL warning are masked !!
Set parameters
Choose statistics :
min
max
mean
[59]:
site = 'NAMUR'
year = '2020'

index_name = 'NDVI'

stat_name = 'mean'

nodata_val = -10000

start = '20200101'
end   = '20201231'
Date
The date must be in each image filename. begin_date is the first position of the date
E.g. : “T31UFS_**2**0200316T104709_NDVI.tif” –> begin_date = 7
[60]:
format     = '%Y%m%d' # format : YYYYMMDD
begin_date = 7
Set directory
[61]:
computer_path = 'X:/'
grp_nb        = '99'

# Directory for all work files
work_path = f'{computer_path}STUDENTS/GROUP_{grp_nb}/'  # Directory for all work files


# Rasters files directory
raster_file_list = sorted(glob.glob(f'{work_path}{index_name}/*{index_name}.tif'))

# Vector file
vector_file  = f'{work_path}B_IN_SITU_PREPRO/{site}_{year}_IN_SITU_ROI_prepared.shp'


# Zonal statistics output
zonal_stat_path = f'{work_path}ZONAL_STATS/'
zonal_stat_csv  = f'{zonal_stat_path}{site}_{year}_zonal_stat_cont_{index_name}.csv'
zonal_stat_shp  = f'{zonal_stat_path}{site}_{year}_zonal_stat_cont_{index_name}.shp'

Path(zonal_stat_path).mkdir(parents=True, exist_ok=True)
Check if raster and vector are projected to the same CRS
[62]:
gdf = gpd.read_file(vector_file)
src = rasterio.open(raster_file_list[0], "r")

crs_vector = str(gdf.crs).split(":",1)[1]
crs_raster = str(src.crs).split(":",1)[1]

if crs_vector == crs_raster:
    print(f'CRS are the same : EPSG:{crs_vector} = EPSG:{crs_raster}')
else:
    print('We must reproject vector file')

    gdf = gdf.to_crs(epsg=crs_raster)
CRS are the same : EPSG:32631 = EPSG:32631
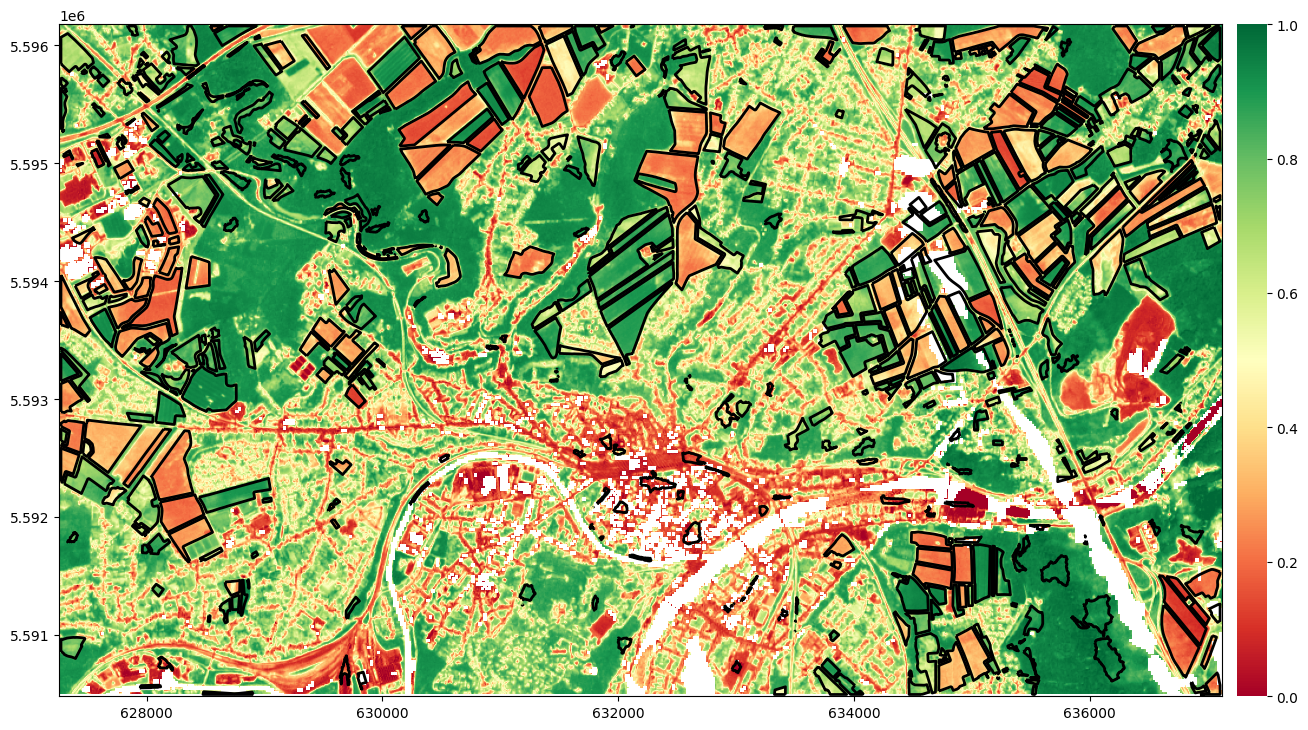
Check if raster and vector file are intersecting
[63]:
fig, ax = plt.subplots(1, 1, figsize=(15,15))

# Plot vector
gdf.plot(facecolor='none', edgecolor='black', linewidth = 2, ax=ax)

# Plot image
color_map = plt.cm.get_cmap("RdYlGn")
reversed_color_map = color_map.reversed()

src = rasterio.open(raster_file_list[6], "r")
im_rio = rasterio.plot.show(src, cmap=color_map, vmin=0, vmax=1, ax=ax)
im_rio = im_rio.get_images()[0]

cax = fig.add_axes([ax.get_position().x1+0.01,ax.get_position().y0,0.02,ax.get_position().height])
plt.colorbar(im_rio, ax=ax, cax=cax)


plt.box(False)
Create a new column ID
get one single ID per polygon
[64]:
gdf["id"] = gdf.index

display(gdf)
| id | lc_nb | lc | grp_nb | grp | class_nb | class | sub_nb | sub | grp_1_nb | grp_1 | grp_A_nb | grp_A | area | pix_count | geometry | |
|---|---|---|---|---|---|---|---|---|---|---|---|---|---|---|---|---|
| 0 | 0 | 3 | Grassland and meadows | 31 | Grassland and meadows | 319 | Grassland and meadows | 3199 | Grassland and meadows | 3 | Grassland and meadows | 3 | Grassland and meadows | 1735 | 17 | MULTIPOLYGON (((630003.573 5594258.004, 630003... |
| 1 | 1 | 3 | Grassland and meadows | 31 | Grassland and meadows | 319 | Grassland and meadows | 3199 | Grassland and meadows | 3 | Grassland and meadows | 3 | Grassland and meadows | 14331 | 146 | POLYGON ((636962.589 5595674.757, 636966.536 5... |
| 2 | 2 | 3 | Grassland and meadows | 31 | Grassland and meadows | 319 | Grassland and meadows | 3199 | Grassland and meadows | 3 | Grassland and meadows | 3 | Grassland and meadows | 1768 | 18 | POLYGON ((635692.119 5593303.601, 635688.405 5... |
| 3 | 3 | 3 | Grassland and meadows | 31 | Grassland and meadows | 319 | Grassland and meadows | 3199 | Grassland and meadows | 3 | Grassland and meadows | 3 | Grassland and meadows | 7828 | 79 | POLYGON ((627911.368 5595749.375, 627942.033 5... |
| 4 | 4 | 3 | Grassland and meadows | 31 | Grassland and meadows | 319 | Grassland and meadows | 3199 | Grassland and meadows | 3 | Grassland and meadows | 3 | Grassland and meadows | 3197 | 39 | POLYGON ((633236.525 5596165.100, 633397.286 5... |
| ... | ... | ... | ... | ... | ... | ... | ... | ... | ... | ... | ... | ... | ... | ... | ... | ... |
| 532 | 532 | 6 | Forest | 69 | Forest | 699 | Forest | 6999 | Forest | 69 | Forest | 6 | Forest | 6221 | 64 | POLYGON ((629637.453 5595004.884, 629637.670 5... |
| 533 | 533 | 6 | Forest | 69 | Forest | 699 | Forest | 6999 | Forest | 69 | Forest | 6 | Forest | 6792 | 65 | POLYGON ((629067.212 5595065.248, 629067.346 5... |
| 534 | 534 | 6 | Forest | 69 | Forest | 699 | Forest | 6999 | Forest | 69 | Forest | 6 | Forest | 1416 | 14 | MULTIPOLYGON (((628763.069 5595549.167, 628763... |
| 535 | 535 | 6 | Forest | 69 | Forest | 699 | Forest | 6999 | Forest | 69 | Forest | 6 | Forest | 7935 | 82 | POLYGON ((631930.369 5595869.595, 631930.856 5... |
| 536 | 536 | 6 | Forest | 69 | Forest | 699 | Forest | 6999 | Forest | 69 | Forest | 6 | Forest | 4670 | 47 | POLYGON ((635764.747 5595906.026, 635766.406 5... |
537 rows × 16 columns
Get date of each image
[65]:
dict_list = []

for im in raster_file_list:

        date_str = os.path.basename(im)[begin_date:begin_date+8]

        date_im = datetime.datetime.strptime(date_str, format).date()

        dict_list.append({'date': date_im,
                          'im_path': im})

im_date_path_df = pd.DataFrame.from_dict(dict_list).sort_values('date')

display(im_date_path_df)
| date | im_path | |
|---|---|---|
| 0 | 2020-01-16 | /export/miro/ndeffense/LBRAT2104/STUDENTS/GROU... |
| 1 | 2020-02-12 | /export/miro/ndeffense/LBRAT2104/STUDENTS/GROU... |
| 2 | 2020-03-16 | /export/miro/ndeffense/LBRAT2104/STUDENTS/GROU... |
| 3 | 2020-04-17 | /export/miro/ndeffense/LBRAT2104/STUDENTS/GROU... |
| 4 | 2020-05-20 | /export/miro/ndeffense/LBRAT2104/STUDENTS/GROU... |
| 5 | 2020-06-21 | /export/miro/ndeffense/LBRAT2104/STUDENTS/GROU... |
| 6 | 2020-07-19 | /export/miro/ndeffense/LBRAT2104/STUDENTS/GROU... |
| 7 | 2020-08-13 | /export/miro/ndeffense/LBRAT2104/STUDENTS/GROU... |
| 8 | 2020-09-14 | /export/miro/ndeffense/LBRAT2104/STUDENTS/GROU... |
| 9 | 2020-10-19 | /export/miro/ndeffense/LBRAT2104/STUDENTS/GROU... |
| 10 | 2020-11-18 | /export/miro/ndeffense/LBRAT2104/STUDENTS/GROU... |
| 11 | 2020-12-18 | /export/miro/ndeffense/LBRAT2104/STUDENTS/GROU... |
Select images inside a period
[66]:
start_date = datetime.datetime.strptime(start, format).date()
end_date   = datetime.datetime.strptime(end, format).date()

mask = (im_date_path_df['date'] > start_date) & (im_date_path_df['date'] <= end_date)

im_date_path_df = im_date_path_df.loc[mask]

display(im_date_path_df)
| date | im_path | |
|---|---|---|
| 0 | 2020-01-16 | /export/miro/ndeffense/LBRAT2104/STUDENTS/GROU... |
| 1 | 2020-02-12 | /export/miro/ndeffense/LBRAT2104/STUDENTS/GROU... |
| 2 | 2020-03-16 | /export/miro/ndeffense/LBRAT2104/STUDENTS/GROU... |
| 3 | 2020-04-17 | /export/miro/ndeffense/LBRAT2104/STUDENTS/GROU... |
| 4 | 2020-05-20 | /export/miro/ndeffense/LBRAT2104/STUDENTS/GROU... |
| 5 | 2020-06-21 | /export/miro/ndeffense/LBRAT2104/STUDENTS/GROU... |
| 6 | 2020-07-19 | /export/miro/ndeffense/LBRAT2104/STUDENTS/GROU... |
| 7 | 2020-08-13 | /export/miro/ndeffense/LBRAT2104/STUDENTS/GROU... |
| 8 | 2020-09-14 | /export/miro/ndeffense/LBRAT2104/STUDENTS/GROU... |
| 9 | 2020-10-19 | /export/miro/ndeffense/LBRAT2104/STUDENTS/GROU... |
| 10 | 2020-11-18 | /export/miro/ndeffense/LBRAT2104/STUDENTS/GROU... |
| 11 | 2020-12-18 | /export/miro/ndeffense/LBRAT2104/STUDENTS/GROU... |
Compute zonal statistics
[67]:
def mean_div_std(x):

    mean = np.mean(x)
    std  = np.std(x)

    result = mean / std

    return result
[68]:
df_list = []
date_list = []

for i, row in im_date_path_df.iterrows():
    im_file    = row['im_path']
    long_date  = row['date']

    day   = str(long_date)[8:10]
    month = str(long_date)[5:7]
    year  = str(long_date)[0:4]

    print(long_date)

    date_list.append(long_date)

    date = day + month + year  # Year at the end because it will be truncated when saved to ESRI Shapefile

    # Open GeoTIFF file
    src = rasterio.open(im_file, 'r')
    im_arr = src.read(1)

    # Change NaN by "nodata_val"
    im_arr = np.nan_to_num(im_arr, nan=nodata_val)

    # Get transform from profile (metadata)
    profile = src.profile
    transform = profile['transform']

    src.close()

    df = pd.DataFrame(zonal_stats(gdf,
                                  im_arr,
                                  affine=transform,
                                  stats=['count','nodata','mean','std'],
                                  nodata=nodata_val,
                                  add_stats={'mean_div_std':mean_div_std}
                                  ))

    df = df.rename(columns={'count': f'valid_{date}','nodata': f'nan___{date}','mean': f'mean__{date}','std': f'std___{date}', 'mean_div_std':f'mDIVs_{date}'})

    df[f'nan___{date}'] = df[f'nan___{date}'].fillna(0)
    df = df.astype({f'nan___{date}': int, f'mDIVs_{date}': float})

    df_list.append(df)


dfs = pd.concat(df_list, axis=1).round(4)

display(dfs)
2020-01-16
2020-02-12
2020-03-16
2020-04-17
2020-05-20
2020-06-21
2020-07-19
2020-08-13
2020-09-14
2020-10-19
2020-11-18
2020-12-18
| mean__16012020 | valid_16012020 | std___16012020 | nan___16012020 | mDIVs_16012020 | valid_12022020 | nan___12022020 | mean__12022020 | std___12022020 | mDIVs_12022020 | ... | mean__18112020 | valid_18112020 | std___18112020 | nan___18112020 | mDIVs_18112020 | mean__18122020 | valid_18122020 | std___18122020 | nan___18122020 | mDIVs_18122020 | |
|---|---|---|---|---|---|---|---|---|---|---|---|---|---|---|---|---|---|---|---|---|---|
| 0 | 0.7138 | 14 | 0.0312 | 3 | 22.8455 | 0 | 17 | NaN | NaN | NaN | ... | 0.6841 | 17 | 0.0833 | 0 | 8.2141 | 0.6790 | 9 | 0.0630 | 8 | 10.7694 |
| 1 | 0.7415 | 146 | 0.0574 | 0 | 12.9216 | 0 | 146 | NaN | NaN | NaN | ... | 0.8539 | 146 | 0.0448 | 0 | 19.0409 | 0.8351 | 144 | 0.0400 | 2 | 20.8726 |
| 2 | 0.7406 | 16 | 0.0357 | 2 | 20.7215 | 16 | 2 | 0.4786 | 0.0737 | 6.4962 | ... | 0.8535 | 18 | 0.0480 | 0 | 17.7676 | 0.6954 | 15 | 0.0386 | 3 | 17.9925 |
| 3 | 0.7697 | 79 | 0.0260 | 0 | 29.6047 | 0 | 79 | NaN | NaN | NaN | ... | 0.7640 | 79 | 0.0298 | 0 | 25.6160 | 0.7487 | 79 | 0.0242 | 0 | 30.9224 |
| 4 | 0.7980 | 39 | 0.0330 | 0 | 24.1716 | 0 | 39 | NaN | NaN | NaN | ... | 0.8348 | 39 | 0.0193 | 0 | 43.1866 | 0.7169 | 34 | 0.0484 | 5 | 14.8120 |
| ... | ... | ... | ... | ... | ... | ... | ... | ... | ... | ... | ... | ... | ... | ... | ... | ... | ... | ... | ... | ... | ... |
| 532 | 0.6257 | 64 | 0.0416 | 0 | 15.0567 | 64 | 0 | 0.5734 | 0.0492 | 11.6547 | ... | 0.6797 | 64 | 0.0526 | 0 | 12.9094 | 0.6268 | 64 | 0.0401 | 0 | 15.6494 |
| 533 | 0.6394 | 65 | 0.0569 | 0 | 11.2332 | 65 | 0 | 0.5745 | 0.0571 | 10.0580 | ... | 0.6395 | 65 | 0.0438 | 0 | 14.5848 | 0.5966 | 65 | 0.0504 | 0 | 11.8441 |
| 534 | NaN | 0 | NaN | 14 | NaN | 12 | 2 | 0.3550 | 0.0127 | 27.9002 | ... | 0.6449 | 2 | 0.0047 | 12 | 136.3782 | NaN | 0 | NaN | 14 | NaN |
| 535 | 0.6236 | 40 | 0.0644 | 42 | 9.6894 | 1 | 81 | 0.1161 | 0.0000 | inf | ... | 0.6887 | 76 | 0.0549 | 6 | 12.5514 | 0.6078 | 44 | 0.0348 | 38 | 17.4622 |
| 536 | 0.6647 | 23 | 0.0568 | 24 | 11.6986 | 25 | 22 | 0.2398 | 0.0488 | 4.9141 | ... | 0.6656 | 46 | 0.0475 | 1 | 14.0081 | 0.6038 | 37 | 0.0534 | 10 | 11.2999 |
537 rows × 60 columns
Plot timeseries
[69]:
df = dfs.filter(regex='mean')

display(df)

df['parcel_id'] = df.index

df = df.set_index('parcel_id')

df = df.transpose()

df['date'] = date_list


df = df.melt(id_vars=['date'], var_name='parcel_id')

df = df.merge(gdf, left_on='parcel_id', right_on='id')

df = df[['date','parcel_id','value','sub_nb','sub','grp_A_nb','grp_A']]

display(df)
| mean__16012020 | mean__12022020 | mean__16032020 | mean__17042020 | mean__20052020 | mean__21062020 | mean__19072020 | mean__13082020 | mean__14092020 | mean__19102020 | mean__18112020 | mean__18122020 | |
|---|---|---|---|---|---|---|---|---|---|---|---|---|
| 0 | 0.7138 | NaN | 0.7600 | 0.8569 | 0.8904 | 0.7054 | 0.4930 | 0.5632 | 0.7701 | 0.8299 | 0.6841 | 0.6790 |
| 1 | 0.7415 | NaN | 0.8128 | 0.8174 | 0.5072 | 0.7863 | 0.9105 | 0.6131 | 0.5675 | 0.5559 | 0.8539 | 0.8351 |
| 2 | 0.7406 | 0.4786 | 0.8318 | NaN | 0.9001 | 0.8394 | 0.8954 | 0.5452 | 0.8298 | 0.7781 | 0.8535 | 0.6954 |
| 3 | 0.7697 | NaN | 0.8018 | 0.8400 | 0.4847 | 0.9029 | 0.4884 | 0.5349 | 0.7208 | 0.8706 | 0.7640 | 0.7487 |
| 4 | 0.7980 | NaN | 0.4641 | 0.8309 | 0.8320 | 0.8217 | 0.8290 | 0.3623 | 0.4581 | 0.7578 | 0.8348 | 0.7169 |
| ... | ... | ... | ... | ... | ... | ... | ... | ... | ... | ... | ... | ... |
| 532 | 0.6257 | 0.5734 | 0.5438 | 0.6859 | 0.9101 | 0.9130 | 0.9377 | 0.8739 | 0.8851 | 0.8435 | 0.6797 | 0.6268 |
| 533 | 0.6394 | 0.5745 | 0.5998 | 0.7141 | 0.9138 | 0.8710 | 0.9132 | 0.8554 | 0.8620 | 0.8155 | 0.6395 | 0.5966 |
| 534 | NaN | 0.3550 | 0.5525 | 0.6162 | 0.9080 | 0.7159 | 0.9503 | 0.8802 | 0.8603 | 0.8137 | 0.6449 | NaN |
| 535 | 0.6236 | 0.1161 | 0.5103 | 0.7072 | 0.8557 | 0.5647 | 0.8717 | 0.8514 | 0.8651 | 0.8027 | 0.6887 | 0.6078 |
| 536 | 0.6647 | 0.2398 | 0.6150 | NaN | 0.8883 | 0.9107 | 0.9244 | 0.9003 | 0.8556 | 0.8268 | 0.6656 | 0.6038 |
537 rows × 12 columns
| date | parcel_id | value | sub_nb | sub | grp_A_nb | grp_A | |
|---|---|---|---|---|---|---|---|
| 0 | 2020-01-16 | 0 | 0.7138 | 3199 | Grassland and meadows | 3 | Grassland and meadows |
| 1 | 2020-02-12 | 0 | NaN | 3199 | Grassland and meadows | 3 | Grassland and meadows |
| 2 | 2020-03-16 | 0 | 0.7600 | 3199 | Grassland and meadows | 3 | Grassland and meadows |
| 3 | 2020-04-17 | 0 | 0.8569 | 3199 | Grassland and meadows | 3 | Grassland and meadows |
| 4 | 2020-05-20 | 0 | 0.8904 | 3199 | Grassland and meadows | 3 | Grassland and meadows |
| ... | ... | ... | ... | ... | ... | ... | ... |
| 6439 | 2020-08-13 | 536 | 0.9003 | 6999 | Forest | 6 | Forest |
| 6440 | 2020-09-14 | 536 | 0.8556 | 6999 | Forest | 6 | Forest |
| 6441 | 2020-10-19 | 536 | 0.8268 | 6999 | Forest | 6 | Forest |
| 6442 | 2020-11-18 | 536 | 0.6656 | 6999 | Forest | 6 | Forest |
| 6443 | 2020-12-18 | 536 | 0.6038 | 6999 | Forest | 6 | Forest |
6444 rows × 7 columns
[70]:
fig = px.line(df,
              x='date',
              y='value',
              color='grp_A_nb',
              line_group='parcel_id',
              hover_data=['sub_nb','sub'],
              title= 'title')

fig.show()
Write output to shapefile
[71]:
gdf_with_zonal_stat = pd.concat([gdf, dfs], axis=1, join="inner")

display(gdf_with_zonal_stat)

#gdf_with_zonal_stat.columns = gdf_with_zonal_stat.columns.astype(str)


gdf_with_zonal_stat.to_file(zonal_stat_shp)

print(f'SHP file was created : {zonal_stat_shp}')
| id | lc_nb | lc | grp_nb | grp | class_nb | class | sub_nb | sub | grp_1_nb | ... | mean__18112020 | valid_18112020 | std___18112020 | nan___18112020 | mDIVs_18112020 | mean__18122020 | valid_18122020 | std___18122020 | nan___18122020 | mDIVs_18122020 | |
|---|---|---|---|---|---|---|---|---|---|---|---|---|---|---|---|---|---|---|---|---|---|
| 0 | 0 | 3 | Grassland and meadows | 31 | Grassland and meadows | 319 | Grassland and meadows | 3199 | Grassland and meadows | 3 | ... | 0.6841 | 17 | 0.0833 | 0 | 8.2141 | 0.6790 | 9 | 0.0630 | 8 | 10.7694 |
| 1 | 1 | 3 | Grassland and meadows | 31 | Grassland and meadows | 319 | Grassland and meadows | 3199 | Grassland and meadows | 3 | ... | 0.8539 | 146 | 0.0448 | 0 | 19.0409 | 0.8351 | 144 | 0.0400 | 2 | 20.8726 |
| 2 | 2 | 3 | Grassland and meadows | 31 | Grassland and meadows | 319 | Grassland and meadows | 3199 | Grassland and meadows | 3 | ... | 0.8535 | 18 | 0.0480 | 0 | 17.7676 | 0.6954 | 15 | 0.0386 | 3 | 17.9925 |
| 3 | 3 | 3 | Grassland and meadows | 31 | Grassland and meadows | 319 | Grassland and meadows | 3199 | Grassland and meadows | 3 | ... | 0.7640 | 79 | 0.0298 | 0 | 25.6160 | 0.7487 | 79 | 0.0242 | 0 | 30.9224 |
| 4 | 4 | 3 | Grassland and meadows | 31 | Grassland and meadows | 319 | Grassland and meadows | 3199 | Grassland and meadows | 3 | ... | 0.8348 | 39 | 0.0193 | 0 | 43.1866 | 0.7169 | 34 | 0.0484 | 5 | 14.8120 |
| ... | ... | ... | ... | ... | ... | ... | ... | ... | ... | ... | ... | ... | ... | ... | ... | ... | ... | ... | ... | ... | ... |
| 532 | 532 | 6 | Forest | 69 | Forest | 699 | Forest | 6999 | Forest | 69 | ... | 0.6797 | 64 | 0.0526 | 0 | 12.9094 | 0.6268 | 64 | 0.0401 | 0 | 15.6494 |
| 533 | 533 | 6 | Forest | 69 | Forest | 699 | Forest | 6999 | Forest | 69 | ... | 0.6395 | 65 | 0.0438 | 0 | 14.5848 | 0.5966 | 65 | 0.0504 | 0 | 11.8441 |
| 534 | 534 | 6 | Forest | 69 | Forest | 699 | Forest | 6999 | Forest | 69 | ... | 0.6449 | 2 | 0.0047 | 12 | 136.3782 | NaN | 0 | NaN | 14 | NaN |
| 535 | 535 | 6 | Forest | 69 | Forest | 699 | Forest | 6999 | Forest | 69 | ... | 0.6887 | 76 | 0.0549 | 6 | 12.5514 | 0.6078 | 44 | 0.0348 | 38 | 17.4622 |
| 536 | 536 | 6 | Forest | 69 | Forest | 699 | Forest | 6999 | Forest | 69 | ... | 0.6656 | 46 | 0.0475 | 1 | 14.0081 | 0.6038 | 37 | 0.0534 | 10 | 11.2999 |
537 rows × 76 columns
SHP file was created : /export/miro/ndeffense/LBRAT2104/STUDENTS/GROUP_99/TP/ZONAL_STATS/NAMUR_2020_zonal_stat_cont_NDVI.shp
Write output to CSV
[72]:
gdf_with_zonal_stat = pd.concat([gdf, dfs], axis=1, join="inner")

gdf_with_zonal_stat = gdf_with_zonal_stat.drop(columns='geometry')

display(gdf_with_zonal_stat)

gdf_with_zonal_stat.to_csv(zonal_stat_csv, sep=';')

print(f'CSV file was created : {zonal_stat_csv}')
| id | lc_nb | lc | grp_nb | grp | class_nb | class | sub_nb | sub | grp_1_nb | ... | mean__18112020 | valid_18112020 | std___18112020 | nan___18112020 | mDIVs_18112020 | mean__18122020 | valid_18122020 | std___18122020 | nan___18122020 | mDIVs_18122020 | |
|---|---|---|---|---|---|---|---|---|---|---|---|---|---|---|---|---|---|---|---|---|---|
| 0 | 0 | 3 | Grassland and meadows | 31 | Grassland and meadows | 319 | Grassland and meadows | 3199 | Grassland and meadows | 3 | ... | 0.6841 | 17 | 0.0833 | 0 | 8.2141 | 0.6790 | 9 | 0.0630 | 8 | 10.7694 |
| 1 | 1 | 3 | Grassland and meadows | 31 | Grassland and meadows | 319 | Grassland and meadows | 3199 | Grassland and meadows | 3 | ... | 0.8539 | 146 | 0.0448 | 0 | 19.0409 | 0.8351 | 144 | 0.0400 | 2 | 20.8726 |
| 2 | 2 | 3 | Grassland and meadows | 31 | Grassland and meadows | 319 | Grassland and meadows | 3199 | Grassland and meadows | 3 | ... | 0.8535 | 18 | 0.0480 | 0 | 17.7676 | 0.6954 | 15 | 0.0386 | 3 | 17.9925 |
| 3 | 3 | 3 | Grassland and meadows | 31 | Grassland and meadows | 319 | Grassland and meadows | 3199 | Grassland and meadows | 3 | ... | 0.7640 | 79 | 0.0298 | 0 | 25.6160 | 0.7487 | 79 | 0.0242 | 0 | 30.9224 |
| 4 | 4 | 3 | Grassland and meadows | 31 | Grassland and meadows | 319 | Grassland and meadows | 3199 | Grassland and meadows | 3 | ... | 0.8348 | 39 | 0.0193 | 0 | 43.1866 | 0.7169 | 34 | 0.0484 | 5 | 14.8120 |
| ... | ... | ... | ... | ... | ... | ... | ... | ... | ... | ... | ... | ... | ... | ... | ... | ... | ... | ... | ... | ... | ... |
| 532 | 532 | 6 | Forest | 69 | Forest | 699 | Forest | 6999 | Forest | 69 | ... | 0.6797 | 64 | 0.0526 | 0 | 12.9094 | 0.6268 | 64 | 0.0401 | 0 | 15.6494 |
| 533 | 533 | 6 | Forest | 69 | Forest | 699 | Forest | 6999 | Forest | 69 | ... | 0.6395 | 65 | 0.0438 | 0 | 14.5848 | 0.5966 | 65 | 0.0504 | 0 | 11.8441 |
| 534 | 534 | 6 | Forest | 69 | Forest | 699 | Forest | 6999 | Forest | 69 | ... | 0.6449 | 2 | 0.0047 | 12 | 136.3782 | NaN | 0 | NaN | 14 | NaN |
| 535 | 535 | 6 | Forest | 69 | Forest | 699 | Forest | 6999 | Forest | 69 | ... | 0.6887 | 76 | 0.0549 | 6 | 12.5514 | 0.6078 | 44 | 0.0348 | 38 | 17.4622 |
| 536 | 536 | 6 | Forest | 69 | Forest | 699 | Forest | 6999 | Forest | 69 | ... | 0.6656 | 46 | 0.0475 | 1 | 14.0081 | 0.6038 | 37 | 0.0534 | 10 | 11.2999 |
537 rows × 75 columns
CSV file was created : /export/miro/ndeffense/LBRAT2104/STUDENTS/GROUP_99/TP/ZONAL_STATS/NAMUR_2020_zonal_stat_cont_NDVI.csv