In situ data preparation
[1]:
import pandas as pd
import geopandas as gpd
import matplotlib.pyplot as plt
import numpy as np
from rasterio import features
import rasterio.plot
from IPython.display import display
import glob

import plotly.express as px
import plotly.offline
plotly.offline.init_notebook_mode()
from pathlib import Path

print('All libraries successfully imported!')
print(f'Pandas    : {pd.__version__}')
print(f'GeoPandas : {gpd.__version__}')
All libraries successfully imported!
Pandas    : 1.5.2
GeoPandas : 0.12.2
Set directory
[2]:
computer_path = 'X:/'
grp_nb        = '99'

# Directory for all work files
work_path = f'{computer_path}STUDENTS/GROUP_{grp_nb}/'
data_path = f'{work_path}data/'

reflectance_path = f'{work_path}3_L2A_MASKED/'

in_situ_path = f'{data_path}A_IN_SITU/'
in_situ_prepro_path = f'{work_path}B_IN_SITU_PREPRO/'

Path(in_situ_prepro_path).mkdir(parents=True, exist_ok=True)
Set parameters
[3]:
site = 'NAMUR'
year = '2020'

no_data = -999

field_id = 'id'
field_classif_code = 'grp_1_nb'
field_classif_name = 'grp_1'
buffer_size   = -10
pix_min       = 3
pix_ratio_min = 0.0002
poly_min      = 4
Set filenames
[4]:
# Input file
in_situ_shp = f'{in_situ_path}{site}_{year}_IN_SITU_ROI.shp'

# Output files
in_situ_tif          = f'{in_situ_prepro_path}{site}_{year}_IN_SITU_ROI_buffer.tif'
in_situ_prepared_shp = f'{in_situ_prepro_path}{site}_{year}_IN_SITU_ROI_prepared.shp'
1. Apply 10m inner buffer to each polygons
[6]:
gdf = gpd.read_file(in_situ_shp)

print(f'The Coordinates Reference System is {gdf.crs} \n')

print(f'There are {len(gdf)} polygons BEFORE applying the {buffer_size}m buffer.')

gdf.geometry = gdf.geometry.buffer(buffer_size)

gdf = gdf[~gdf.geometry.is_empty]    # Remove empty geometries

print(f'There are {len(gdf)} polygons AFTER applying the {buffer_size}m buffer.')

display(gdf.head())
The Coordinates Reference System is epsg:32631

There are 733 polygons BEFORE applying the -10m buffer.
There are 628 polygons AFTER applying the -10m buffer.
| id | lc_nb | lc | grp_nb | grp | class_nb | class | sub_nb | sub | grp_1_nb | grp_1 | grp_A_nb | grp_A | geometry | |
|---|---|---|---|---|---|---|---|---|---|---|---|---|---|---|
| 0 | 1 | 3 | Grassland and meadows | 31 | Grassland and meadows | 319 | Grassland and meadows | 3199 | Grassland and meadows | 3 | Grassland and meadows | 3 | Grassland and meadows | MULTIPOLYGON (((636113.254 5595481.323, 636113... |
| 1 | 2 | 3 | Grassland and meadows | 31 | Grassland and meadows | 319 | Grassland and meadows | 3199 | Grassland and meadows | 3 | Grassland and meadows | 3 | Grassland and meadows | POLYGON ((629775.101 5593157.573, 629778.482 5... |
| 2 | 3 | 3 | Grassland and meadows | 31 | Grassland and meadows | 319 | Grassland and meadows | 3199 | Grassland and meadows | 3 | Grassland and meadows | 3 | Grassland and meadows | POLYGON ((636748.981 5595728.374, 636750.028 5... |
| 3 | 4 | 3 | Grassland and meadows | 31 | Grassland and meadows | 319 | Grassland and meadows | 3199 | Grassland and meadows | 3 | Grassland and meadows | 3 | Grassland and meadows | MULTIPOLYGON (((630003.573 5594258.004, 630003... |
| 4 | 5 | 3 | Grassland and meadows | 31 | Grassland and meadows | 319 | Grassland and meadows | 3199 | Grassland and meadows | 3 | Grassland and meadows | 3 | Grassland and meadows | POLYGON ((636962.589 5595674.757, 636966.536 5... |
[7]:
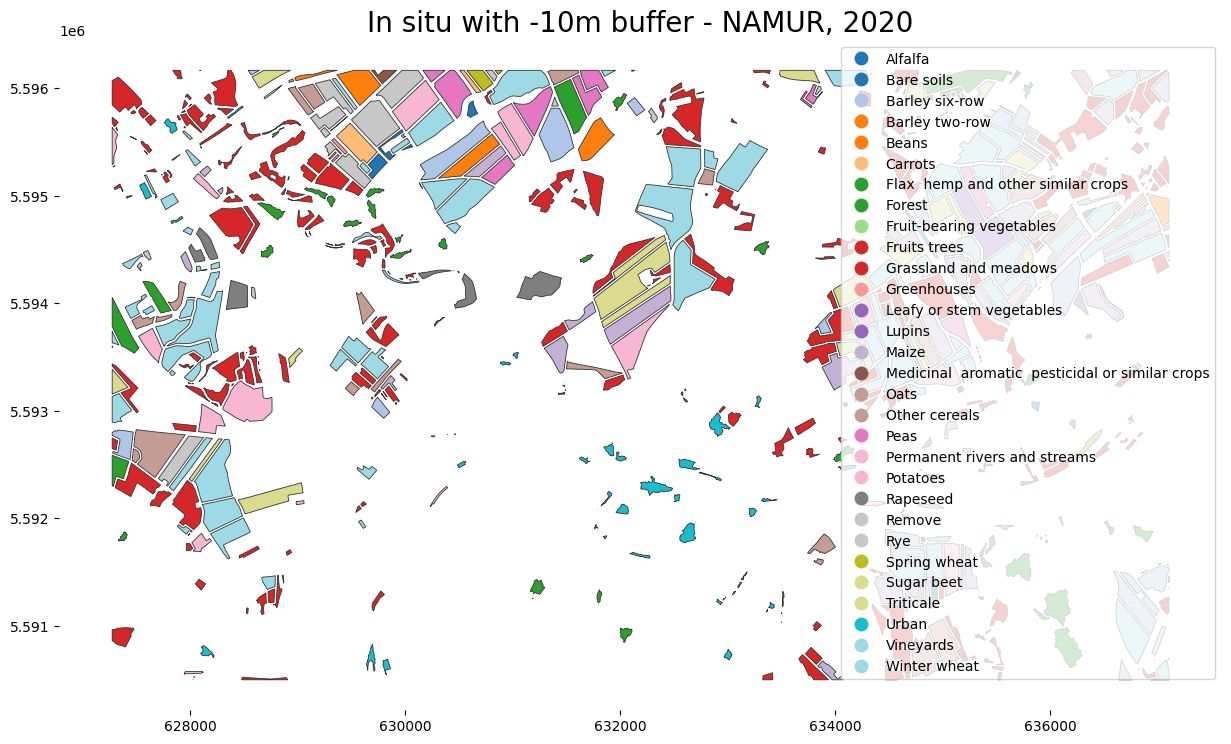
fig, ax = plt.subplots(1, 1, figsize=(15,15))

gdf.plot(ax=ax,
        column=field_classif_name,
        categorical=True,
        cmap='tab20',
        linewidth=.6,
        edgecolor='0.2',
        legend=True)

ax.set_title(f'In situ with {buffer_size}m buffer - {site}, {year}',fontsize=20)

plt.box(False)
2. Add polygon area
[8]:
gdf['area'] = gdf.geometry.area.astype(int)

display(gdf.head())
| id | lc_nb | lc | grp_nb | grp | class_nb | class | sub_nb | sub | grp_1_nb | grp_1 | grp_A_nb | grp_A | geometry | area | |
|---|---|---|---|---|---|---|---|---|---|---|---|---|---|---|---|
| 0 | 1 | 3 | Grassland and meadows | 31 | Grassland and meadows | 319 | Grassland and meadows | 3199 | Grassland and meadows | 3 | Grassland and meadows | 3 | Grassland and meadows | MULTIPOLYGON (((636113.254 5595481.323, 636113... | 0 |
| 1 | 2 | 3 | Grassland and meadows | 31 | Grassland and meadows | 319 | Grassland and meadows | 3199 | Grassland and meadows | 3 | Grassland and meadows | 3 | Grassland and meadows | POLYGON ((629775.101 5593157.573, 629778.482 5... | 235 |
| 2 | 3 | 3 | Grassland and meadows | 31 | Grassland and meadows | 319 | Grassland and meadows | 3199 | Grassland and meadows | 3 | Grassland and meadows | 3 | Grassland and meadows | POLYGON ((636748.981 5595728.374, 636750.028 5... | 251 |
| 3 | 4 | 3 | Grassland and meadows | 31 | Grassland and meadows | 319 | Grassland and meadows | 3199 | Grassland and meadows | 3 | Grassland and meadows | 3 | Grassland and meadows | MULTIPOLYGON (((630003.573 5594258.004, 630003... | 1735 |
| 4 | 5 | 3 | Grassland and meadows | 31 | Grassland and meadows | 319 | Grassland and meadows | 3199 | Grassland and meadows | 3 | Grassland and meadows | 3 | Grassland and meadows | POLYGON ((636962.589 5595674.757, 636966.536 5... | 14331 |
3. Add pixel count
3.1 Select one raster clipped to the extent of the ROI as a template to rasterize in situ polygons
[9]:
img_temp_tif = glob.glob(f'{reflectance_path}*.tif')[0]

print(f'Raster template file : {img_temp_tif}')
Raster template file : /export/miro/ndeffense/LBRAT2104/STUDENTS/GROUP_99/TP/3_L2A_MASKED/T31UFS_20200116T105309_B02_10m_ROI_SCL.tif
3.2 Rasterize in situ polygons
[10]:
# Open the raster file you want to use as a template for rasterize

src = rasterio.open(img_temp_tif, "r")

# Update metadata

out_meta = src.meta
out_meta.update(dtype='int16',
                nodata=no_data)

# Burn the features into the raster and write it out

dst = rasterio.open(in_situ_tif, 'w+', **out_meta)
dst_arr = dst.read(1)

# this is where we create a generator of geom, value pairs to use in rasterizing

geom_col = gdf.geometry
code_col = gdf[field_id].astype(int)

shapes = ((geom,value) for geom, value in zip(geom_col, code_col))

in_situ_arr = features.rasterize(shapes=shapes,
                                 fill=no_data,
                                 out=dst_arr,
                                 transform=dst.transform,
                                 all_touched=False)     # If false, only pixels whose center is within the polygon will be burned in.

dst.write_band(1, in_situ_arr)

# Close rasterio objects
src.close()
dst.close()

print(f'Rasterize is done : {in_situ_tif}')
Rasterize is done : /export/miro/ndeffense/LBRAT2104/STUDENTS/GROUP_99/TP/B_IN_SITU_PREPRO/NAMUR_2020_IN_SITU_ROI_buffer.tif
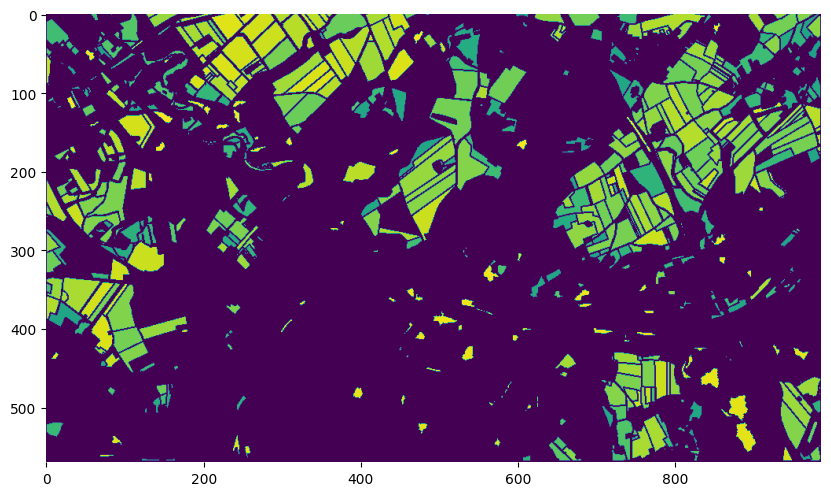
[11]:
fig, ax = plt.subplots(1, 1, figsize=(10,10))

rasterio.plot.show(in_situ_arr, ax=ax)

plt.box(False)
3.3 Count number of pixels for each polygons
[12]:
unique, counts = np.unique(in_situ_arr, return_counts=True)
pix_count_df = pd.DataFrame(zip(unique, counts), columns=['id','pix_count'], dtype='int16')

display(pix_count_df)
/tmp/ipykernel_20119/83254786.py:2: FutureWarning:

Values are too large to be losslessly cast to int16. In a future version this will raise OverflowError. To retain the old behavior, use pd.Series(values).astype(int16)
| id | pix_count | |
|---|---|---|
| 0 | -999 | -12677 |
| 1 | 2 | 2 |
| 2 | 4 | 17 |
| 3 | 5 | 146 |
| 4 | 6 | 18 |
| ... | ... | ... |
| 600 | 729 | 77 |
| 601 | 730 | 23 |
| 602 | 731 | 82 |
| 603 | 732 | 47 |
| 604 | 733 | 44 |
605 rows × 2 columns
3.4 Merge pixels count with polygons informations
[13]:
pix_count_gdf = gdf.merge(pix_count_df, on='id', how="left")

display(pix_count_gdf.head())

print(f'There are {len(pix_count_gdf)} polygons')
| id | lc_nb | lc | grp_nb | grp | class_nb | class | sub_nb | sub | grp_1_nb | grp_1 | grp_A_nb | grp_A | geometry | area | pix_count | |
|---|---|---|---|---|---|---|---|---|---|---|---|---|---|---|---|---|
| 0 | 1 | 3 | Grassland and meadows | 31 | Grassland and meadows | 319 | Grassland and meadows | 3199 | Grassland and meadows | 3 | Grassland and meadows | 3 | Grassland and meadows | MULTIPOLYGON (((636113.254 5595481.323, 636113... | 0 | NaN |
| 1 | 2 | 3 | Grassland and meadows | 31 | Grassland and meadows | 319 | Grassland and meadows | 3199 | Grassland and meadows | 3 | Grassland and meadows | 3 | Grassland and meadows | POLYGON ((629775.101 5593157.573, 629778.482 5... | 235 | 2.0 |
| 2 | 3 | 3 | Grassland and meadows | 31 | Grassland and meadows | 319 | Grassland and meadows | 3199 | Grassland and meadows | 3 | Grassland and meadows | 3 | Grassland and meadows | POLYGON ((636748.981 5595728.374, 636750.028 5... | 251 | NaN |
| 3 | 4 | 3 | Grassland and meadows | 31 | Grassland and meadows | 319 | Grassland and meadows | 3199 | Grassland and meadows | 3 | Grassland and meadows | 3 | Grassland and meadows | MULTIPOLYGON (((630003.573 5594258.004, 630003... | 1735 | 17.0 |
| 4 | 5 | 3 | Grassland and meadows | 31 | Grassland and meadows | 319 | Grassland and meadows | 3199 | Grassland and meadows | 3 | Grassland and meadows | 3 | Grassland and meadows | POLYGON ((636962.589 5595674.757, 636966.536 5... | 14331 | 146.0 |
There are 628 polygons
4. Remove unnecessary in situ polygons
4.1 Remove polygons with less than pix_min pixels
[14]:
gdf = pix_count_gdf.loc[pix_count_gdf['pix_count'] >= pix_min]

gdf = gdf.astype({"pix_count": int})

print(f'There are {len(gdf)} polygons with more (or equal) than {pix_min} pixels.')
There are 583 polygons with more (or equal) than 3 pixels.
4.2 Remove polygons from under represented and unwanted classes
Under represented classes mean the classes with :
not enough pixels - less than
pix_ratio_min% of the total number of pixels (default : 0.0002%)not enough polygons - less than
poly_minpolygons (default : 5 polygons)
Unwanted classes mean the classes we don’t want to work with
[15]:
# Get number of pixels per class

pix_per_class_df = gdf.groupby([field_classif_code, field_classif_name])['pix_count'].agg('sum').to_frame().reset_index()
pix_per_class_df = pix_per_class_df.sort_values(by='pix_count', ascending=False)
pix_per_class_df['ratio'] = pix_per_class_df['pix_count'] / pix_per_class_df['pix_count'].sum()

# Get number of polygons per class

poly_per_class_df = gdf.groupby([field_classif_code, field_classif_name])[field_classif_code].agg('count').reset_index(name='poly_count')
poly_per_class_df = poly_per_class_df.sort_values(by='poly_count', ascending=False)

# Merge 2 previous dataframe in a single one
pix_poly_per_class_df = pix_per_class_df.merge(poly_per_class_df, on=[field_classif_code, field_classif_name], how="outer")

display(pix_poly_per_class_df)
| grp_1_nb | grp_1 | pix_count | ratio | poly_count | |
|---|---|---|---|---|---|
| 0 | 1111 | Winter wheat | 29633 | 0.255640 | 74 |
| 1 | 3 | Grassland and meadows | 23889 | 0.206087 | 221 |
| 2 | 1121 | Maize | 8667 | 0.074769 | 36 |
| 3 | 1811 | Sugar beet | 7400 | 0.063839 | 21 |
| 4 | 1152 | Barley six-row | 6659 | 0.057446 | 20 |
| 5 | 1511 | Potatoes | 6439 | 0.055548 | 14 |
| 6 | 1192 | Other cereals | 6117 | 0.052771 | 17 |
| 7 | 0 | Remove | 4068 | 0.035094 | 28 |
| 8 | 1771 | Peas | 3606 | 0.031108 | 10 |
| 9 | 69 | Forest | 3109 | 0.026821 | 35 |
| 10 | 1923 | Flax hemp and other similar crops | 2810 | 0.024241 | 8 |
| 11 | 21 | Fruits trees | 2239 | 0.019316 | 7 |
| 12 | 1435 | Rapeseed | 1826 | 0.015753 | 6 |
| 13 | 81 | Urban | 1795 | 0.015485 | 36 |
| 14 | 1151 | Barley two-row | 1660 | 0.014321 | 3 |
| 15 | 121 | Leafy or stem vegetables | 1351 | 0.011655 | 4 |
| 16 | 1711 | Beans | 835 | 0.007203 | 2 |
| 17 | 1171 | Oats | 776 | 0.006694 | 8 |
| 18 | 1231 | Carrots | 723 | 0.006237 | 2 |
| 19 | 1911 | Alfalfa | 554 | 0.004779 | 7 |
| 20 | 1112 | Spring wheat | 405 | 0.003494 | 3 |
| 21 | 84 | Greenhouses | 252 | 0.002174 | 5 |
| 22 | 1161 | Rye | 230 | 0.001984 | 2 |
| 23 | 9212 | Permanent rivers and streams | 208 | 0.001794 | 4 |
| 24 | 22 | Vineyards | 178 | 0.001536 | 4 |
| 25 | 1115 | Triticale | 149 | 0.001285 | 1 |
| 26 | 1761 | Lupins | 140 | 0.001208 | 2 |
| 27 | 1931 | Medicinal aromatic pesticidal or similar crops | 138 | 0.001191 | 1 |
| 28 | 72 | Bare soils | 61 | 0.000526 | 2 |
[16]:
list_all_classes             = set(pix_poly_per_class_df[field_classif_code].values)
list_under_represented_class = set(pix_poly_per_class_df.loc[(pix_poly_per_class_df['ratio'] < pix_ratio_min) | (pix_poly_per_class_df['poly_count'] < poly_min)][field_classif_code].values)
list_unwanted_class          = {0, 1992}

list_well_represented_class = set(list_all_classes - list_under_represented_class - list_unwanted_class)

print(f'---> {len(list_well_represented_class)} well-represented classes (>= {pix_ratio_min}% & >= {poly_min} polygons) :\n {sorted(list_well_represented_class)}')
print(f'---> {len(list_under_represented_class)} under-represented classes (< {pix_ratio_min}% & < {poly_min} polygons) :\n {sorted(list_under_represented_class)}')
print(f'---> {len(list_unwanted_class)} unwanted classes :\n {sorted(list_unwanted_class)}')

gdf = gdf.loc[gdf[field_classif_code].isin(list_well_represented_class)]

display(gdf.head())

print(f'There are {len(gdf)} polygons from well-represented classes.')
---> 19 well-represented classes (>= 0.0002% & >= 4 polygons) :
 [3, 21, 22, 69, 81, 84, 121, 1111, 1121, 1152, 1171, 1192, 1435, 1511, 1771, 1811, 1911, 1923, 9212]
---> 9 under-represented classes (< 0.0002% & < 4 polygons) :
 [72, 1112, 1115, 1151, 1161, 1231, 1711, 1761, 1931]
---> 2 unwanted classes :
 [0, 1992]
| id | lc_nb | lc | grp_nb | grp | class_nb | class | sub_nb | sub | grp_1_nb | grp_1 | grp_A_nb | grp_A | geometry | area | pix_count | |
|---|---|---|---|---|---|---|---|---|---|---|---|---|---|---|---|---|
| 3 | 4 | 3 | Grassland and meadows | 31 | Grassland and meadows | 319 | Grassland and meadows | 3199 | Grassland and meadows | 3 | Grassland and meadows | 3 | Grassland and meadows | MULTIPOLYGON (((630003.573 5594258.004, 630003... | 1735 | 17 |
| 4 | 5 | 3 | Grassland and meadows | 31 | Grassland and meadows | 319 | Grassland and meadows | 3199 | Grassland and meadows | 3 | Grassland and meadows | 3 | Grassland and meadows | POLYGON ((636962.589 5595674.757, 636966.536 5... | 14331 | 146 |
| 5 | 6 | 3 | Grassland and meadows | 31 | Grassland and meadows | 319 | Grassland and meadows | 3199 | Grassland and meadows | 3 | Grassland and meadows | 3 | Grassland and meadows | POLYGON ((635692.119 5593303.601, 635688.405 5... | 1768 | 18 |
| 6 | 7 | 3 | Grassland and meadows | 31 | Grassland and meadows | 319 | Grassland and meadows | 3199 | Grassland and meadows | 3 | Grassland and meadows | 3 | Grassland and meadows | POLYGON ((627911.368 5595749.375, 627942.033 5... | 7828 | 79 |
| 7 | 9 | 3 | Grassland and meadows | 31 | Grassland and meadows | 319 | Grassland and meadows | 3199 | Grassland and meadows | 3 | Grassland and meadows | 3 | Grassland and meadows | POLYGON ((633236.525 5596165.100, 633397.286 5... | 3197 | 39 |
There are 537 polygons from well-represented classes.
Plot histogram
[17]:
df = pix_poly_per_class_df.loc[pix_poly_per_class_df[field_classif_code].isin(list_well_represented_class)]

display(df)
| grp_1_nb | grp_1 | pix_count | ratio | poly_count | |
|---|---|---|---|---|---|
| 0 | 1111 | Winter wheat | 29633 | 0.255640 | 74 |
| 1 | 3 | Grassland and meadows | 23889 | 0.206087 | 221 |
| 2 | 1121 | Maize | 8667 | 0.074769 | 36 |
| 3 | 1811 | Sugar beet | 7400 | 0.063839 | 21 |
| 4 | 1152 | Barley six-row | 6659 | 0.057446 | 20 |
| 5 | 1511 | Potatoes | 6439 | 0.055548 | 14 |
| 6 | 1192 | Other cereals | 6117 | 0.052771 | 17 |
| 8 | 1771 | Peas | 3606 | 0.031108 | 10 |
| 9 | 69 | Forest | 3109 | 0.026821 | 35 |
| 10 | 1923 | Flax hemp and other similar crops | 2810 | 0.024241 | 8 |
| 11 | 21 | Fruits trees | 2239 | 0.019316 | 7 |
| 12 | 1435 | Rapeseed | 1826 | 0.015753 | 6 |
| 13 | 81 | Urban | 1795 | 0.015485 | 36 |
| 15 | 121 | Leafy or stem vegetables | 1351 | 0.011655 | 4 |
| 17 | 1171 | Oats | 776 | 0.006694 | 8 |
| 19 | 1911 | Alfalfa | 554 | 0.004779 | 7 |
| 21 | 84 | Greenhouses | 252 | 0.002174 | 5 |
| 23 | 9212 | Permanent rivers and streams | 208 | 0.001794 | 4 |
| 24 | 22 | Vineyards | 178 | 0.001536 | 4 |
[18]:
fig = px.bar(df,
             x=df[field_classif_name],
             y=df['pix_count'],
             text='poly_count',
             labels={'pix_count': 'Number of pixels'})

fig.update_layout(xaxis_title=None)


fig.show()
Write geodataframe into a shapefile
[19]:
gdf.to_file(in_situ_prepared_shp)

print(f'New shapefile has been created : {in_situ_prepared_shp}')
New shapefile has been created : /export/miro/ndeffense/LBRAT2104/STUDENTS/GROUP_99/TP/B_IN_SITU_PREPRO/NAMUR_2020_IN_SITU_ROI_prepared.shp